
A Map That Can’t Measure: The Operational Tax of Raster Dimensions
Imagine you're responsible for the physical network inventory of a large utility or telecom company. Your team manages over 50,000 scanned engineering drawings. While critical assets, like cables and communication devices, are already in your network information system, a crucial piece of information remains trapped in these static images: over one million dimension lines that provide the precise location of your infrastructure. The following key pain points were identified that largely affect daily network operations and require resolution:
- Loss of Geometric Precision: Lines are stored as pixels, causing pixelation and positional ambiguity when scaled or zoomed. This compromises the accuracy of critical measurements and engineering fidelity.
- Lack of Data Intelligence: Dimension lines lack associated attributes (e.g., actual value, unit, layer), making the data not queryable and preventing automated analysis (e.g., "Find all lines over 2m").
- High-Friction Editing: Any revision, a common daily task, requires a laborious, multi-step process, sometimes involving vectorization and re-rasterization. This creates a significant bottleneck in maintenance and quality control workflows.
- Data Redundancy and Storage Overhead: High-resolution raster files mean large file sizes. This increases storage costs, slows network transfer, and demands higher processing power for display and manipulation.
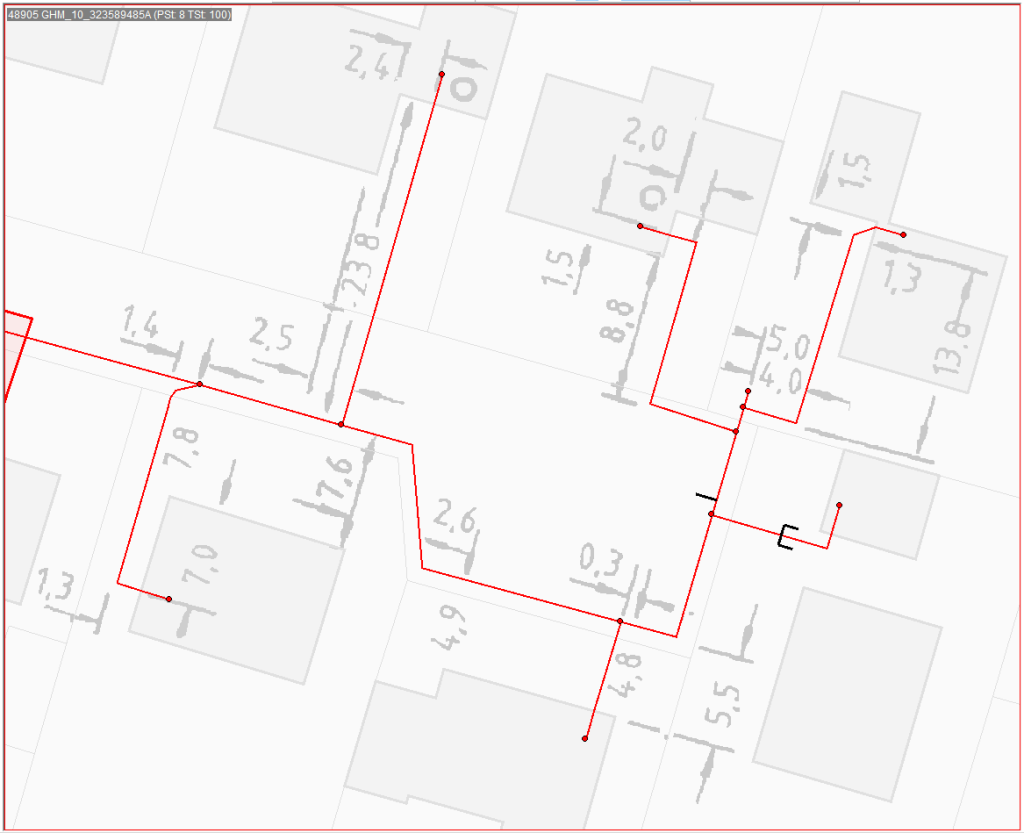
Figure 1: Original static raster-based dimensions
The goals are therefore clear. First, you need to “liberate” this valuable data, integrate it into your modern network information system, and retire the burdensome raster files. Second, you must address a hidden data quality crisis. Your team knows that some dimensions have incorrect numerical values, but these errors are impossible to detect by visual inspection of the drawings alone, causing significant problems for the field workforce.
The problem is the immense scale and the need for near-perfect data quality. A manual approach, that is, digitizing the scanned raster images by hand, is a non-starter, with estimates suggesting the project would take 10 to 15 years. This creates a massive gap between the current state (valuable data is locked away and unreliable) and the desired state (data is structured, trustworthy, and static images are history). This article details how that gap was closed in a fraction of the time and with far less human effort and presents four valuable lessons learned from this project.
#1: Choose the Right Tool for the Job
When the discussion turns to automated document processing today, AI technology is often the first thing that comes to mind. The first step in any AI project is to resist the urge to use the most talked-about technology for every problem. In this case, the utility company had already tried to apply Large Language Models (LLMs) to interpret the drawings, only to abandon the effort due to poor results.
A Practical Look at the Technology: An LLM is a master of language, but it is not inherently a computer vision tool. For a task involving the recognition of shapes and text from images, a Convolutional Neural Network (CNN) is a far more suitable approach. By choosing a tool built for the task, the probability of a successful outcome increases dramatically. The alternative is deeply problematic; some companies, after a failed attempt with the wrong technology, simply abandon valuable legacy data, falsely concluding that no technical solution exists.
#2: Combine AI with Expert Rules for Precision
How can you achieve the highest possible automation rate without sacrificing data quality? In this context, the automation rate is the percentage of dimensions correctly digitized without any human intervention. With AI alone, achieving a rate over 95% is often impossible. The real breakthrough came from a hybrid system that combined the CNN's pattern-finding ability with the precision of a deterministic, rules-based algorithm.
A Look at the Process: The process worked in two distinct steps:
- The AI "Eyes" (The CNN): First, the CNN scanned the maps to find the atomic components of a dimension. It was trained to do one thing exceptionally well: identify pixels that likely represent a numerical value (e.g., "15.5 m"), a dimension line, or an arrow, regardless of orientation.
- The "Expert Brain" (The Rules Engine): The AI's output was a collection of disconnected digital parts. A post-processing algorithm then acted as an expert drafter. It used encoded engineering rules to logically assemble these parts into a final, structured dimension object. Critically, it applied contextual logic to "snap" the dimension's endpoints to the correct features—like a building corner or a specific pipeline joint—transforming a simple line into a meaningful piece of relational data.
#3: Demand Verifiable Results to Build Trust
A common challenge with AI is trusting its output. As explored in a post on LLMs, probabilistic systems can produce results that are difficult to validate. In a high-stakes engineering context, trust in the data quality isn't optional; it's a requirement.
Achieving Trustworthy Results: The hybrid approach delivered a multi-layered verification process. First, the CNN doesn't just identify an element; it also produces a confidence score (from 0% to 100%) for each recognition. This score quantifies how certain the AI is that it has correctly identified and classified a specific set of pixels (e.g., "I am 99.2% sure this is the number '5'"). This turns the AI from a black box into a system that communicates its own uncertainty, allowing for intelligent quality control.
But the system's transparency doesn't end with a number. The ultimate proof came from visualizing the structured vector data. This meant the AI's performance could be instantly verified by overlaying the digital results directly onto the original scanned map. This two-step validation was unambiguous:
- Confidence-Based Filtering: Results with high confidence scores were automatically processed, while low-score items were flagged for a human expert. This focused manual effort precisely where it was most needed.
- Unambiguous Visual Verification: By overlaying the final vector data onto the original scanned map, even the automatically approved results could be instantly verified. A correctly digitized dimension appeared perfectly aligned with the source image, while an error or omission was immediately obvious.
#4: Turn Automation into an Opportunity for Deeper Insight
The initial goal was simply to automate a slow, manual process. However, the project ultimately delivered value far beyond speed and efficiency. The newly structured data became a tool for improving the quality of the source information itself.
Once a dimension was digitized, a new kind of quality check became possible. A simple script calculated the geometric length of the dimension line and compared it to its numerical annotation. If a line's geometry measured 10.2 meters but its label read "15.0 meters," a probable error in the original source document was flagged. This elevated the project from simple data migration to a high-value data integrity initiative, allowing the client to find and correct historical inaccuracies that could impact field operations.
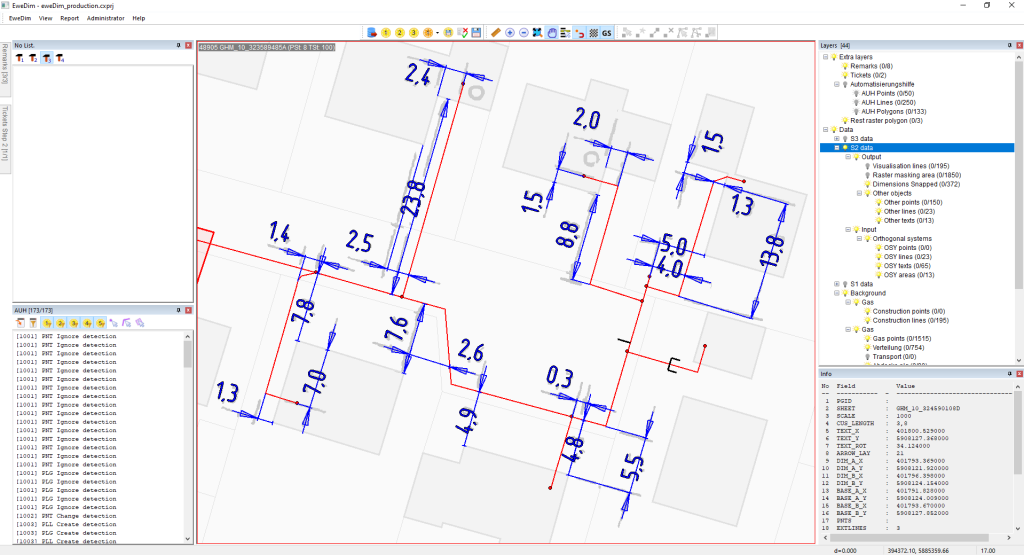
Figure 2: The Grayscale layer displays the original scanned raster image. The Red lines represent the existing network communication lines (input data). The Blue lines show the dimension lines, which are automatically created and precisely snapped to the red communication lines using the hybrid AI/CNN and rules-based post-processing algorithms.
Conclusion
In one of our previous posts, we noted that probabilistic systems like LLMs often cause trust and reliability issues in the overall quality of the result. For network inventory data, high accuracy is demanded; for example, being sure a communication line is 6.9 meters, not 9.6 meters, from the roadside building is non-negotiable.
This computer vision project presents a sharp contrast to the LLM approach. The hybrid approach, which combines AI/CNN pattern recognition with expert rule-based algorithms, has achieved automation results exceeding 90% with verifiable precision. The remaining fraction is handled by a human-in-the-loop workflow, focusing expert intervention only on the most difficult cases. That is a massive efficiency improvement over manual digitization or data capture.
This shift isn't just theoretical; it's what allowed an initial 10- to 15-year project to be completed in less than 18 months, capturing and quality-controlling over 50,000 dimension lines per month.
True success in overcoming such immense data challenges isn't about finding a single solution; it's about designing a complete, specialized system where every component plays to its strengths.