

DEPARTMENT: NETWORK DOCUMENTATION / IT / GIS TEAMS / MARKETING / SALES
THE PROBLEM:
Teams responsible for managing fiber network operations often say that it is better to have no information than to have incorrect information. Another common saying, “garbage in, garbage out,” highlights the importance of maintaining reliable network documentation and its various visualizations across all departments within the telecom operator. In order to address these challenges, documentation and data quality processes are established to continuously monitor and improve the accuracy of network inventories.
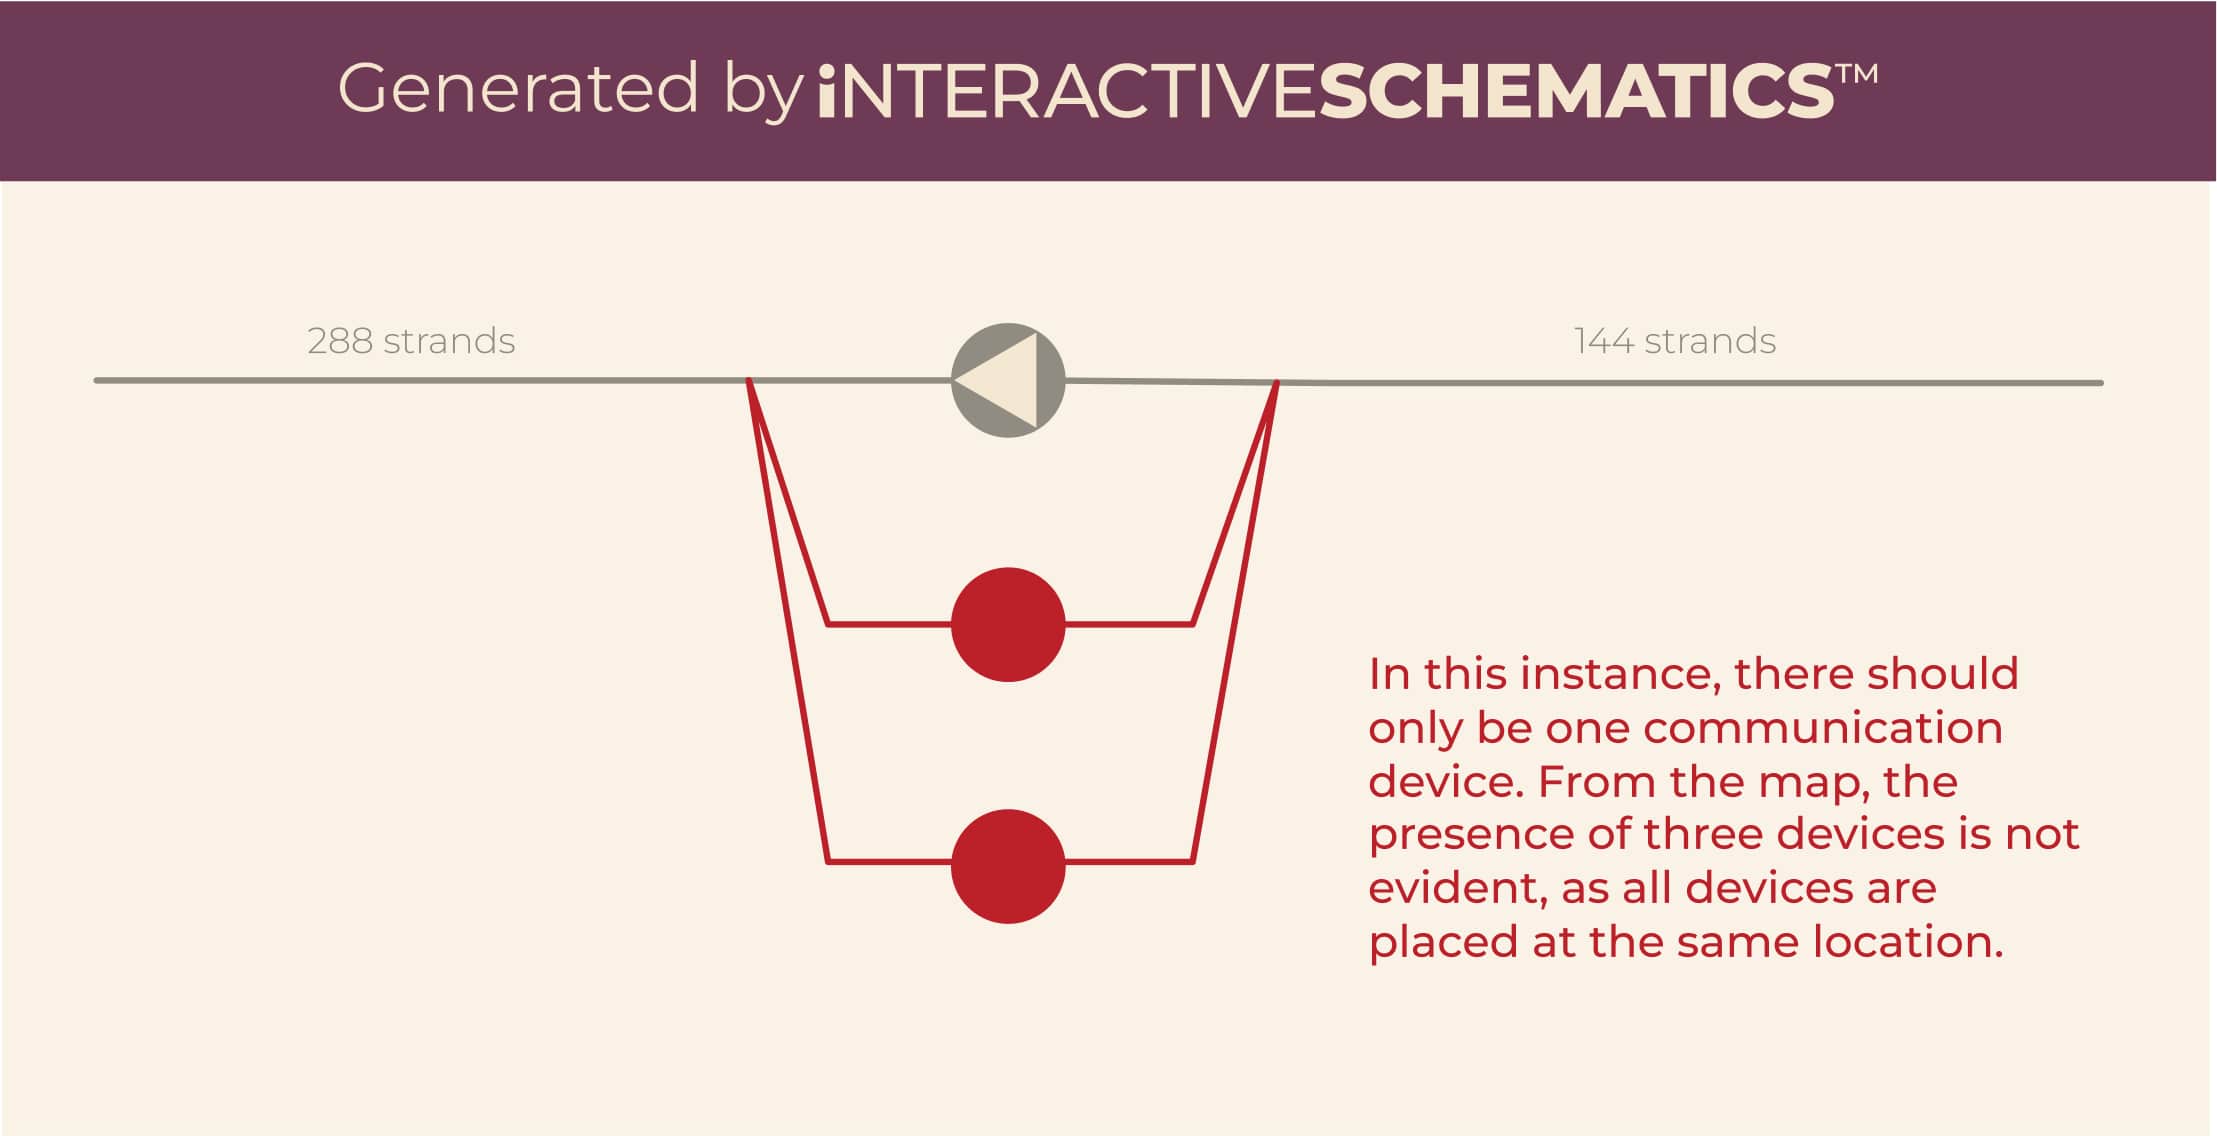
The complexity of fiber networks makes their structure and content difficult to manage. While fiber management systems include validation algorithms to detect errors based on predefined rules, certain issues remain undetectable without manual or visual intervention. For example, a GIS view of a fiber network may reveal some discrepancies, but many issues—such as the way fibers are connected within a splice closure—can still go undetected because the topological relationships are not always displayed. Maps help identify potential errors in the location of network resources, while schematics and splicing diagrams offer insight into the relationships between network resources. If fiber-port level data cannot be clearly visualized in a user-friendly manner that reflects network topology in a clear and structured way, these errors may remain unresolved, potentially leading to challenges for teams managing the network.
HOW DFG iNTERACTIVE SCHEMATICS™ SOLVES THE PROBLEM:
iNTERACTIVE SCHEMATICS™ addresses this problem by combining multiple datasets at the fiber-port level to create intuitive visualizations in which network or topology errors become immediately apparent. Additionally, the tool can generate a list of detected errors on request, with each error linked to its exact location on the interactive schematic, making it easy to pinpoint and address discrepancies. This approach effectively identifies errors that cannot be detected by automated validation algorithms or be easily seen on maps.
Users begin by selecting a subset of network data, such as a specific geographical area or network segment. iNTERACTIVE SCHEMATICS™ then generates detailed schematics for the physical network based on the current documentation data, with the option of superimposing logical and service-level data if requested. Any detected errors are visually flagged in the schematics for easy identification, and a list of errors is generated with a brief description. When a user clicks on an error record, the schematic view zooms into the specific location of that issue, enabling quick visual inspection. Users can then toggle between the schematic and documentation/GIS systems and leverage the editing functionality of the fiber management system to address the discrepancies as needed.
“Map-based and schematic-based visualizations of a network each have an important role in the operational processes at a telecom, and each team is used to its way of interacting with the network. We developed iNTERACTIVE SCHEMATICS™ as a live-linked extension to GIS with the aim of allowing teams to visualize the network in a way that is most relevant to
its job. iNTERACTIVE SCHEMATICS™ provides a crucial topological view of the network that the fiber management system does not automatically provide, but it was also an essential design requirement that those two systems be linked so that they stay in synch with each other.”
“Initially, detecting errors in fiber-level data was a painstaking process. We could only generate views of one network element at a time and relied heavily on tabular data presentations or on the results of tracing algorithm. Now, with the ability to visualize various network inventories—physical, logical, and service information—simultaneously at the fiber-port level, our processes have been transformed. The process is now foolproof. Most importantly, the level of trust in our data has increased significantly across the company.”

• Increased trust in the data across the company;
• Improved decision-making based on reliable data.