
Outside plant telecom networks are vast, complex physical organisms. Because of that, the technicians and engineers who operate them do not interact with the network directly for most tasks, at least not initially. Instead, as the first step, they consult its virtual counterpart: documentation in the form of tables, maps, and diagrams.
Humans operate the outside plant physical network. Therefore, the documentation must be designed for human cognition. If a technician cannot instantly understand a map or a diagram, they risk making the wrong decision, prolonging outages, or misallocating resources, to name just a few examples. Thus, the documentation serves as the primary interface for network operations.
Maps or geographic information systems (GIS) provide the necessary spatial context - "where" assets are located. However, a detailed analysis of a database storing fibre network elements (outside plant) will often show a very telling story: the vast majority of records are non-spatial, meaning most of the telecom fibre network (outside plant) cannot be represented on the map. Containment relationships, for example, a rack is the parent of a slot, and connectivity relationships at the fibre-port level form an "infinite" wealth of data at this "microscopic" level. This data cannot be visualized on a map or GIS view but is critical to understanding the network.
Schematic and splice diagrams provide the essential connectivity context - "if" and "how" assets are connected. Schematic diagrams, such as single-line diagrams (SLDs) and splice diagrams, are fundamental to every stage of the telecommunications network lifecycle.
The critical "job to be done"
To understand why this specific documentation is necessary, we must look at the reality of the field workforce. Their job is to execute complex tasks, sometimes under time pressure, for example:
- Build: greenfield network construction and roll-outs.
- Provisioning: connecting new business or retail subscribers.
- Troubleshooting: troubleshooting faults in real-time.
- Maintenance: brownfield operations, such as extending the existing network, moving a cable due to sudden roadworks, or moving an OLT because it is in a flooded area etc.
For every one of these jobs, the goal is identical: minimize the time of decision-making and minimize the probability of making a wrong decision.
Do solely tabular outputs or maps support those decisions? Rarely. The teams need a specific "connectivity" view of the network: clear single-line diagrams (SLDs) and end-to-end splice diagrams.
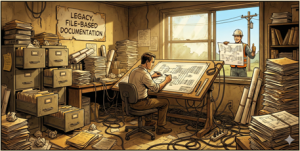
The file-based era
To understand the current situation related to physical network documentation, we have to go back to history. There are many different situations telecom operators went through to reach today’s state. Some telecom operators managed copper networks and then started building fiber networks. They had established network documentation processes and standards in place already from the copper era. Some telecom operators decided to merge with or acquire many smaller telecom operators, each with a different approach and standards for physical network documentation. And there emerged new telecom operators without past experience, which is sometimes also good - starting from scratch, without any legacy limitations from the past.
No matter which group a telecom operator comes from, many of them prioritized the build over documentation, meaning the speed of the build - how many homes passed was the key success indicator. However, once network operations start, the documentation question becomes more and more important.
In many cases the "truth" about the physical network has been scattered across disparate servers and files:
- Legacy documentation: different standards resulting from mergers and acquisitions.
- CAD drawings: vector-based files from the planning phase.
- PDF or raster scans: scans of paper maps containing "red-pen" as-built updates.
- Visio & Excel: diagrams on shared drives and spreadsheets ("splice tables") conveying connectivity.
This approach to organizing and managing documentation has significant disadvantages:
- High effort & cost: every update required manual intervention by skilled workers, often months after the field changes occurred.
- Operational blindness: with data locked in isolated files, basic analysis such as counting splice closures, calculating cable lengths, or even answering "what is my network worth?" was almost impossible.
- Lost revenue: with files scattered across servers, no one knew which version was the "most recent." Sales teams promised connectivity based on outdated maps, leading to embarrassing blunders and "field survey required" delays.
- Lower customer satisfaction: troubleshooting meant sending a technician into the field to physically trace a cable because the "as-built" documentation was actually "as-planned" and hadn't been touched since construction. Investigating the situation on-site is often time-consuming, and most customers expect quick fixes.
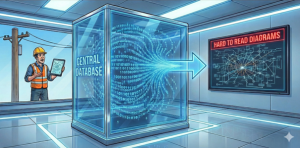
Introducing the system of record
To escape this file-based documentation disarray, many telecom operators initiated massive digital transformation projects. Operators invested millions in network information systems and data migration projects to centralize their legacy data.
This was often a Herculean effort. There are at least three different approaches to data conversion and migration. One is fully automatic, one is fully manual, and the third is automatic with minimized human intervention, where algorithmic processing flags situations that cannot be handled by the rules and humans intervene to resolve those identified discrepancies. This last approach is often regarded as the most optimal one.
A data conversion approach that works 90% well is, for many large telecom operators, not good enough. If 10% of their legacy data is still trapped in static files, that represents thousands of subscribers or many kilometers of fiber network. Many telecom operators today wrestle with data-related challenges, and the risk is high because the data is critically important. The data quality improvement aspect of those data projects is thus vital. It required extensive data cleansing to resolve discrepancies hidden within legacy documentation. Many realized their data was "dirty" - riddled with errors invisible on a CAD or PDF drawing but glaringly obvious in a database.
There were many cases where quality was ignored or postponed to the future. The line of thinking was: "We identified errors in the legacy documentation, but fixing them would require human intervention we don't have resources for now. We will transfer the data as it is (dirty) to the central database and fix it later." Often, this does not work. Resources are never found for this task and data-quality related problems only grow larger with time. A long-term approach to fixing this works best: define areas where data is dirty or missing and instruct operations field teams to investigate. While visiting an area to connect a subscriber, they can verify the situation and provide feedback to the documentation team.
The pressure to fix the data issue is now even stronger due to mandates to introduce AI. Preparing strategies where AI could be applied often meets data-related questions like: "We can leverage AI, but do we have data on which AI could be applied?" Applying AI to data that is still trapped in static images, or applying it to "garbage" data, will not yield the expected results. Furthermore, telecom operators are aware that some data about their physical network simply does not exist or has never been captured.
And then, after all, the day came. Success. The physical network inventory was in one central database. A "single source of truth" was available. A sigh of relief, assuming that once the data was migrated, the system would automatically generate the necessary visual counterparts. For geographical maps (GIS) and tabular data, this works perfectly. But what about schematics and splice diagrams?
The new problem
In the old file-based era, schematic and splice drawings were hard to manage, but they were human-readable. They used symbols, spacing, and layout to convey complex engineering logic. A human brain designed them for another human brain.
When legacy documentation was migrated to the network information system, those drawings were converted into database records, effectively stripping them down to: "Point A connects to Point B." Graphical elements like symbols and lines from the original CAD or PDF drawings were not converted into the database. It was assumed that the modern network information system could recreate those drawings automatically from the raw data stored in the central database. However, that assumption was put to the test, as it has proven to be a notoriously hard challenge: creating "first-time-right" schematics and splice diagrams at the level a skilled human can produce.
When you ask standard tools to generate a view, they often produce a cluttered, hard-to-read diagram with bent lines and overlapping text. No technician can use this for split-second decisions during an outage. This triggers a dangerous chain reaction where clutter leads to confusion, confusion leads to error, and error leads to serious financial implications:
- Clutter: a messy schematic makes the situation impossible to understand quickly.
- Confusion: the engineer doesn't understand the topology and, under pressure, must guess.
- Error: they make the wrong decision (e.g., disconnecting the wrong customer).
- Financial impact: longer fix times, higher operational costs, and lost revenue.
This challenge is confirmed by surveys showing that schematic and splice diagrams are still mostly created manually - in 50% to 66% of cases. In the remaining cases, they are automated but adjusted manually and then stored as static images that exist independently of the constantly updating central database.
To fix this, you are forced to take a step backward. Because the auto-generated diagrams are often not directly usable, engineers revert to drawing diagrams manually or using "cleanup" tools to drag and drop lines until they look right.
Manually "cleaning up" the layout to achieve human-level quality is not low-skill work; it is a high-stress, manual process, that involves, among other, these steps:
- They meticulously reposition objects to reduce overlapping
- They straighten bent lines to make paths logical
- They align splices so the flow is clear
And technicians do not like doing this. Why?
- Waste of expertise: instead of using the schematic to solve a problem, they must first fix the schematic to make it usable.
- Exhaustion: this manual repositioning requires immense "brainpower." It is a draining, tedious task that saps the energy needed for the complex analytical work they are actually paid to do.

Figure 1: SAVE causes disconnect from the single source of truth
The death of the single source of truth
Here is the fundamental flaw: to preserve that manual effort, these tools save the manually corrected layout. By saving the visual arrangement separately from the dynamic network data, a second source of truth has been just introduced.
Imagine the data in the central database changes constantly. The rate of change depends on the operator's profile:
- High-growth operators: aggressively building, experiencing change rates closer to 25-30% due to greenfield construction.
- Incumbent operators: lower growth (3-5%) but higher maintenance and modernization churn (e.g., copper retirement). Their net change rate settles in the 5-10% range, driven by "delete" and "modify" transactions.
Even with a 5-10% change rate, keeping thousands of splice diagrams synchronized with the updates in the central database is a massive burden. Your technician, who just spent hours making a schematic usable, is now caught in the regeneration trap.
They have two bad choices:
- Choice A: the manual patch. They manually patch the new cable into the old static schematic. This creates a duplicate data maintenance problem and risks desynchronizing the GIS and the schematic. This is how wrong decisions get made.
- Choice B: the lost effort. They run the "automatic" tool again to pull in the new cable. But the algorithm runs again and wipes out their five hours of manual cleanup. They are right back at step 1.
A telecom operator is now managing a synchronization challenge.
- Cost: you are back to paying skilled engineers to play "digital draftsman." Creating and maintaining these static records is estimated to cost up to 2.5% of the total network investment.
- The "winter" delay: we often see documentation departments waiting for the winter lull to catch up on "as-builts." The network is generating revenue, but the documentation doesn't exist yet. If a fault occurs in that window, the technician is flying blind.
- First-time-wrong risk: if a technician trusts a saved PDF that is out of date (because the database changed but the diagram didn't), they make the wrong decision. The diagram becomes misleading.
Why the "standard" algorithms often fail
To understand the solution, we must first diagnose why most modern network information systems fail to generate usable diagrams. One probable reason is that network information system vendors are under pressure to support a sprawling feature set. This may cover billing integration, work order management, GIS rendering, reporting, and more. However, automated schematic generation is a task of a mathematical and algorithmic nature. It requires expertise in advanced graph theory, collision detection, and orthogonal layout logic. It is far removed from standard CRUD (Create, Read, Update, Delete) database operations. This is likely why vendors often decide to integrate off-the-shelf commercial libraries or open-source graph libraries to handle diagram creation.
These generic graph libraries are designed for broad use cases like organizational charts, IT networks, or flowcharts. When applied to the unique complexity of telecom fiber networks, they struggle:
- The single-line limit: These libraries may support the creation of high-level single-line diagrams (SLDs) to a passable extent. However, they often fail when encountering specific network topologies. Backbone rings or complex redundancy structures are rarely well-supported in standard graphing packages.
- The "splice" gap: The critical failure happens at the low level. Generic libraries simply may not support the creation of end-to-end splice diagrams. Visualizing connectivity at the strand-and-port level is a challenge unique to the telecom industry. No other industry requires a visualization that tracks a signal through a containment hierarchy of Trench, Duct, Cable, Buffer, and Fiber across multiple splice closures to a final port. Because generic libraries lack the logic to handle this nesting and "micro-connectivity," they often produce cluttered diagrams that technicians cannot easily comprehend.
It is difficult to solve a fiber-specific mathematical problem with a generic visualization tool. To generate a diagram that a technician can trust, specifically one that visualizes the containment of ducts and the continuity of individual fibers across kilometers of network, one needs an engine built specifically for that purpose. That often takes a team fully dedicated to solving the mathematical challenges of telecom fiber network topology.
The solution lies in true automation: no save button
To resolve this paradox, the solution is not to fix the diagrams manually but to fix the algorithms. In reality, the goal of most network information system tools is to save a manually created or modified diagram. That actually means preparing "as-built" documentation in advance, before troubleshooting or provisioning teams need it.
The goal of truly automated visualization is to make the live algorithm so smart that you do not need as-built documentation prepared in advance. It is just data in the central database. With a single click, the troubleshooting or provisioning teams get a visually clear diagram generated from the data stored in the central database.
To implement this, there must be a two-part solution:
- The advanced algorithm: The schematic algorithm itself must be very advanced. The initial, automatic output should already be at a very high level, meaning clean, logical, and usable without human intervention.
- Algorithm control (not manual editing): This is the key. You do not "rescue" the drawing by moving graphics. Instead, you steer the algorithm. The user keeps the human-in-the-loop to provide instructions to the engine, for example:
- Click "collapse" to instruct the algorithm to render a complex POP as a single object.
- Click "filter" to hide unconnected fibers.
- Use "trace" to instruct the algorithm to display a specific end-to-end path.
These are rules applied to the live engine, not edits to a static file.
The golden rule: there should be no "save" button for the geometry of a schematic.

Figure 2: No SAVE button. Always single source of truth.
If you have to save the drawing, you have created a second source of truth. The diagram must be generated live, on-demand, and directly from the database every single time and most importantly, it must be usable on the spot without any human intervention to make it visually clear.
Addressing the fear: the "safety net"
The most common objection to a fully dynamic, "no save" approach is operational risk. Operators ask: "What if the system is down? What if connectivity is lost during a major storm and my technicians cannot generate the live diagram?"
This is a valid concern. However, the solution is not to manually maintain static files "just in case." The solution is automated disaster recovery.
Because the advanced algorithm is fully automated, it can be triggered by a scheduler. You can configure the system to automatically generate and export PDF or image snapshots of key network segments every night or every week.
- The difference: these files are not "sources of truth." They are read-only backups
- The workflow: in normal operations, technicians use the live, dynamic system. In a catastrophic outage where the system is offline, they fall back to the "nightly build" folder
- The result: you have a safety net for emergencies, but you never suffer the cost of manually updating those files. The system does the work
To summarize the fundamental differences, the following table compares the features of the legacy approach, the current digitization paradox, and the future of true automation.

Conclusion
You may have spent the last decade fighting to digitize your data. Don't let the visualization gap render that investment useless.
If your technicians are still manually creating single-line diagrams, or just "improving" the output, the goals of your digital transformation may not yet have been met. True efficiency comes when the diagram is an instant, accurate reflection of the network - created by code, not by hand. See how iNTERACTIVE SCHEMATICS™ automatically generates diagrams directly from the NIS database in seconds: iNTERACTIVE SCHEMATICS™.